
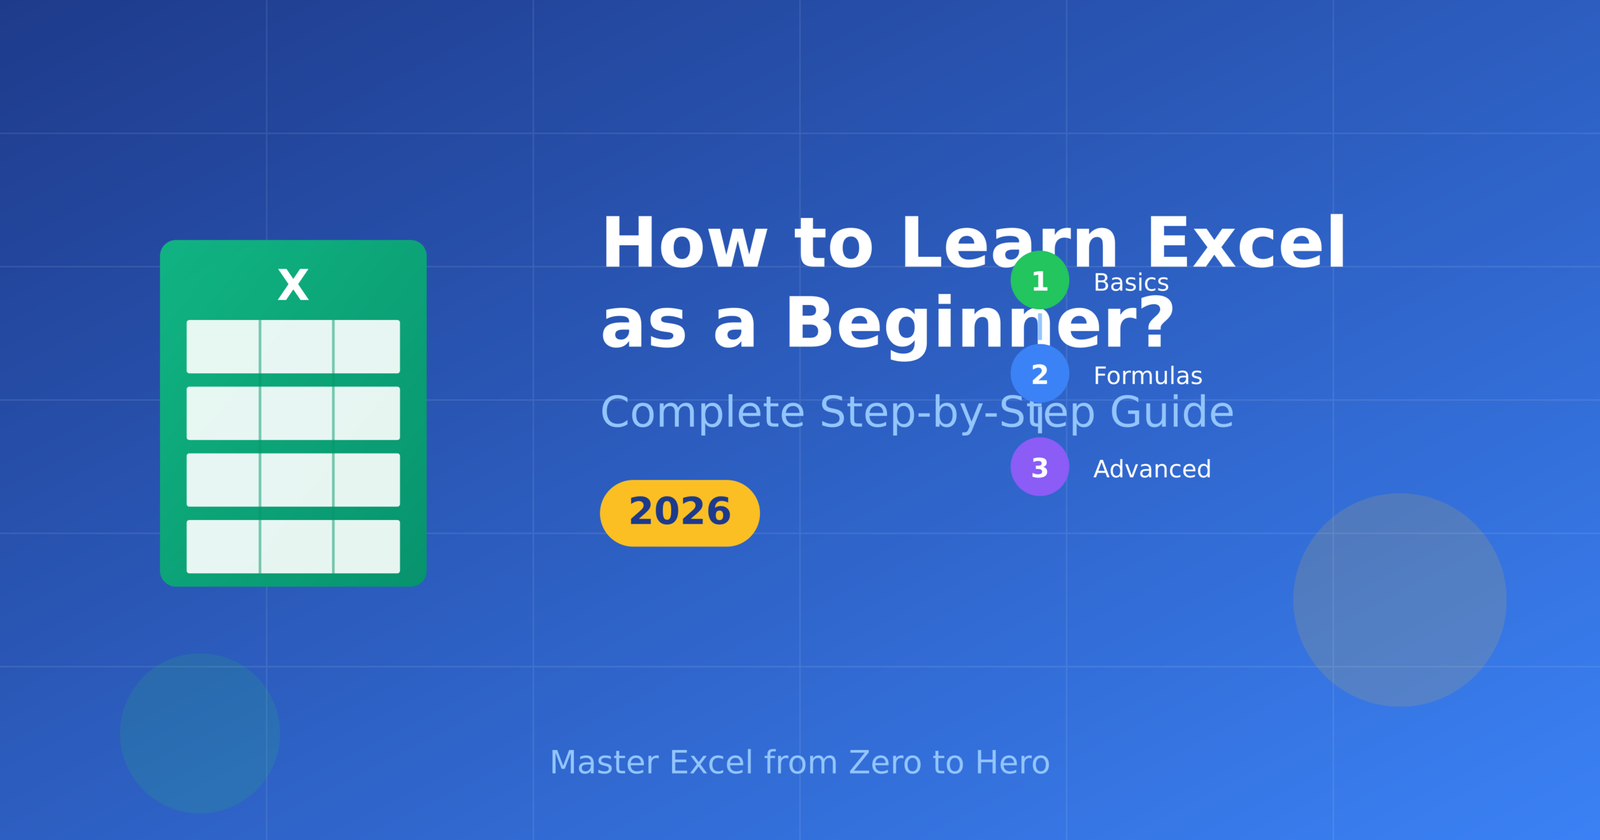
Microsoft Excel remains one of the most powerful and widely-used spreadsheet applications in the world, transforming how individuals and businesses organize, analyze, and visualize data. Whether you’re a student managing assignments, a professional tracking budgets, or someone simply looking to develop essential digital skills, mastering Excel opens doors to countless opportunities. This comprehensive guide will walk you through everything you need to know to start your Excel journey with confidence.
Understanding What Microsoft Excel Actually Does
Before diving into the technical details, it’s helpful to understand what makes Excel so valuable. At its core, Excel is a spreadsheet program that allows you to store information in a grid format made up of rows and columns. However, reducing Excel to just a data storage tool would be like calling a smartphone merely a device for making calls.
Excel excels at organizing data, performing calculations automatically, creating visual representations through charts and graphs, analyzing trends, and even automating repetitive tasks. From calculating monthly expenses to forecasting business revenue, Excel serves as a digital Swiss Army knife for anyone working with numbers and information.
Getting Started: Opening Excel and Understanding the Interface
When you first launch Microsoft Excel, you’ll encounter what might seem like an overwhelming interface. Don’t let this intimidate you. The layout follows a logical structure designed to make your work more efficient once you understand the basics.
The ribbon sits at the top of your screen, containing tabs like Home, Insert, Page Layout, and Formulas. Each tab houses related tools and functions. Think of the ribbon as organized drawers in a toolbox, with each drawer containing specific instruments for particular tasks.
Below the ribbon, you’ll find the formula bar, which displays the contents of whatever cell you’ve selected. This becomes particularly important when working with formulas and functions, as it shows the actual formula rather than just the calculated result.
The main workspace consists of the grid where you’ll spend most of your time. Columns are labeled with letters (A, B, C, and so on), while rows are numbered (1, 2, 3, continuing downward). Each intersection of a column and row creates a cell, which serves as the fundamental unit where you enter data.
Creating Your First Workbook and Entering Data
Starting a new workbook is straightforward. When you open Excel, you can select a blank workbook or choose from various templates. For beginners, starting with a blank workbook allows you to learn without distractions.
Click on any cell to select it. You’ll notice the cell becomes highlighted with a border, indicating it’s active and ready to receive input. Simply start typing to enter data. Press Enter to move down to the next cell, or press Tab to move to the cell on the right.
Excel automatically recognizes different types of data. When you type numbers, Excel treats them as numerical values that can be used in calculations. Text entries are left-aligned by default, while numbers align to the right. Dates have their own special format, and understanding how Excel interprets dates becomes crucial for time-based calculations.
Mastering Basic Navigation Techniques
Efficient navigation saves enormous amounts of time as your spreadsheets grow larger. While you can always use your mouse to click on cells, keyboard shortcuts offer faster alternatives.
The arrow keys move you one cell in any direction. Pressing Ctrl plus an arrow key jumps you to the edge of data in that direction, allowing rapid movement across large spreadsheets. Ctrl+Home takes you instantly to cell A1, while Ctrl+End jumps to the last cell containing data.
Page Up and Page Down move your view up or down by one screen, helping you navigate lengthy documents without losing your place. Learning these shortcuts might feel awkward initially, but they quickly become second nature and dramatically improve your productivity.
Formatting Cells to Improve Readability
Raw data entered into a spreadsheet can look plain and difficult to read. Formatting transforms your spreadsheet into a polished, professional document that communicates information clearly.
To format cells, first select them by clicking and dragging across the desired range. The Home tab contains most formatting options you’ll need. You can change fonts, adjust text size, apply bold or italic styling, and modify text color.
Number formatting deserves special attention. Excel offers numerous ways to display numbers, including currency, percentages, dates, and more. To access these options, right-click on selected cells and choose Format Cells, or use the number format dropdown in the Home tab. Displaying numbers as currency automatically adds dollar signs and decimal places, while percentage format converts decimals into readable percentages.
Cell borders and shading help organize information visually. Adding borders around headers or using alternating row colors makes tables easier to scan. The Fill Color button applies background colors, while the Borders button adds lines around cells.
Working With Formulas: Excel’s True Power
Formulas represent where Excel transitions from a simple data storage tool to a powerful calculation engine. Every formula begins with an equals sign, signaling to Excel that you’re about to perform a calculation rather than enter text.
The most basic formulas use mathematical operators. Type =5+3 into a cell and press Enter, and Excel displays 8. However, the real magic happens when you reference other cells in your formulas. Type =A1+A2 and Excel adds whatever values exist in those cells. Change the numbers in A1 or A2, and the formula result updates automatically.
You can use standard mathematical operators: plus for addition, minus for subtraction, asterisk for multiplication, and forward slash for division. Parentheses control the order of operations, just as in standard mathematics. The formula =(A1+A2)*A3 adds the first two cells before multiplying by the third.
Cell references can be copied to other cells, and Excel intelligently adjusts them. If you write a formula in cell B1 that references A1, copying that formula to B2 will automatically adjust it to reference A2. This relative referencing allows you to write one formula and apply it across entire columns or rows.
Essential Functions Every Beginner Should Know
While formulas handle basic math, functions are pre-built formulas designed for specific tasks. Excel includes hundreds of functions, but beginners should focus on a core set that handles most common needs.
The SUM function adds numbers together. Instead of writing =A1+A2+A3+A4+A5, you can write =SUM(A1:A5). The colon indicates a range, meaning all cells from A1 through A5. This becomes invaluable when summing dozens or hundreds of values.
AVERAGE calculates the mean of a range of numbers. The syntax =AVERAGE(B1:B10) finds the average of all values in that range, automatically excluding any empty cells or text entries.
COUNT tallies how many cells contain numbers in a specified range, while COUNTA counts all non-empty cells regardless of content type. These functions help you quickly understand how much data you’re working with.
MAX and MIN identify the largest and smallest values in a range respectively. These prove useful when analyzing datasets to find extremes, such as your highest expense or lowest sales day.
The IF function introduces conditional logic, allowing Excel to make decisions. The syntax =IF(A1>100,"High","Low") checks whether A1 exceeds 100, displaying “High” if true and “Low” if false. This opens doors to sophisticated data analysis and categorization.
Creating Charts and Graphs for Visual Impact
Numbers in cells tell one story, but visual representations often communicate insights more effectively. Excel’s charting capabilities transform raw data into compelling visuals.
To create a chart, first select the data you want to visualize, including any headers. Navigate to the Insert tab and choose from various chart types. Column charts compare values across categories, line charts show trends over time, and pie charts display proportions of a whole.
After inserting a chart, Excel provides customization options through the Chart Design and Format tabs. You can modify colors, add titles, adjust axis labels, and include legends. Experimenting with these options helps you discover what presentation style best communicates your specific data story.
The Quick Layout feature offers pre-designed chart arrangements, saving time while ensuring professional results. Don’t hesitate to try different chart types with the same data, as different visualizations highlight different aspects of your information.
Sorting and Filtering Data Like a Professional
As your spreadsheets grow, finding specific information becomes challenging. Excel’s sorting and filtering tools help you manage and analyze large datasets efficiently.
To sort data, select your data range and click the Sort button in the Data tab. You can sort by any column in ascending or descending order. When working with tables that have headers, Excel automatically recognizes them and excludes them from sorting.
Filters add dropdown menus to your column headers, allowing you to show only rows meeting specific criteria. Click the Filter button in the Data tab to activate this feature. The dropdown arrows let you select specific values to display, hide unwanted data, or create custom filters based on conditions like “greater than” or “contains.”
These tools prove invaluable when working with customer lists, sales records, inventory data, or any substantial dataset where you need to focus on specific subsets of information.
Understanding Workbooks Versus Worksheets
A common source of confusion for beginners involves the difference between workbooks and worksheets. A workbook is the entire Excel file, while worksheets are individual tabs within that workbook. Think of a workbook as a book and worksheets as individual pages.
By default, new workbooks start with one worksheet, but you can add more by clicking the plus icon near the bottom of the screen. This allows you to organize related data across multiple sheets while keeping everything in one file.
You can rename worksheets by double-clicking their tabs, making it easier to navigate complex workbooks. For example, a budget workbook might contain separate sheets for each month or different categories of expenses.
Moving between worksheets is as simple as clicking their tabs, and you can reference data from other sheets in your formulas using syntax like =Sheet2!A1, which refers to cell A1 on Sheet2.
Saving Your Work and Understanding File Formats
Protecting your work through regular saving is crucial. Excel offers several save formats, each serving different purposes. The standard .xlsx format works for most situations and is compatible with modern Excel versions.
The Save button or Ctrl+S shortcut saves your current work. When saving for the first time, Excel prompts you to choose a location and filename. Selecting descriptive names helps you find files later, especially as your Excel library grows.
For compatibility with older Excel versions, you can save as .xls, though this limits access to newer features. The .csv format creates comma-separated value files that other programs can easily read, though this strips away formatting and formulas.
Excel also offers AutoRecover features that periodically save your work automatically. Adjusting these settings in Options provides an extra safety net against unexpected closures or crashes.
Printing Your Spreadsheets Effectively
Getting your spreadsheet from screen to paper requires attention to detail. Excel’s print options help ensure your printed documents look professional and communicate clearly.
Before printing, use Print Preview to see how your spreadsheet will appear on paper. This reveals issues like data cut off at page edges or awkward page breaks. The Page Layout tab offers tools to adjust margins, orientation, and scaling.
Setting a print area defines exactly which cells to print, preventing waste from printing unnecessary blank pages. Select your desired range, then click Print Area and Set Print Area in the Page Layout tab.
Headers and footers add context to printed pages, including information like page numbers, dates, or document titles. These elements appear in the Insert tab under Header & Footer when in Page Layout view.
Building Your Skills Through Practice
Mastering Excel requires hands-on experience with real projects. Start small by creating a personal budget tracking your monthly income and expenses. This practical application reinforces basic skills while providing genuine value in your daily life.
As you grow more comfortable, challenge yourself with increasingly complex projects. Build a gradebook for tracking academic performance, create an inventory system for household items, or develop a fitness tracker recording workout progress over time.
Excel’s vast capabilities mean there’s always something new to learn. Online resources, video tutorials, and community forums provide endless opportunities to expand your knowledge. The key lies in maintaining curiosity and willingness to experiment.
Moving Forward With Confidence
Microsoft Excel represents a skill that continues delivering value throughout your personal and professional life. While this guide covers fundamental concepts, remember that every Excel expert started exactly where you are now—looking at a blank spreadsheet and wondering where to begin.
The journey from beginner to proficient user happens through consistent practice and willingness to explore features beyond your current comfort zone. Don’t fear making mistakes; Excel’s Undo button (Ctrl+Z) makes experimentation safe and encourages learning through trial and error.
As you develop your skills, you’ll discover that Excel transforms tedious manual calculations into automated processes, reveals patterns hidden in raw data, and communicates complex information through elegant visualizations. These capabilities make Excel not just a software program but an essential tool for navigating our increasingly data-driven world.
Start today with one simple project, and watch as your confidence and capabilities grow with each formula you write and each dataset you analyze. Your Excel journey begins with a single cell, but the possibilities extend far beyond what any spreadsheet grid can contain.